
This blog post was originally published on https://fabiandablander.com/r/Corona-Party.html.
There is no doubt that, every now and then, one ought to celebrate life. This usually involves people coming together, talking, laughing, dancing, singing, shouting; simply put, it means throwing a party. With temperatures rising, summer offers all the more incentive to organize such a joyous event. Blinded by the light, it is easy to forget that we are, unfortunately, still in a pandemic. But should that really deter us?
Walking around central Amsterdam after sunset, it is easy to notice that not everybody holds back. Even if my Dutch was better, it would likely still be difficult to convince groups of twenty-somethings of their potential folly. Surely, they say, it is exceedingly unlikely that this little party of ours results in any virus transmission?
Government retorts by shifting perspective: while the chances of virus spreading at any one party may indeed be small, this does not licence throwing it. Otherwise many parties would mushroom, considerably increasing the chances of virus spread. Indeed, government stresses, this is why such parties remain illegal.
But while if-everybody-did-what-you-did type of arguments score high with parents, they usually do no score high with their children. So instead, in this post, we ask the question from an individual’s perspective: what are the chances of getting the virus after attending this or that party? And what factors make this more or less likely?
As a disclaimer, I should say that I am not an epidemiologist — who, by the way, are a more cautious bunch than I or the majority of my age group — and so my assessment of the evidence may not agree with expert opinion. With that out of the way, and without further ado, let’s dive in.
Risky business?
To get us started, let’s define the risk of a party as the probability that somebody who is infected with the novel coronavirus and can spread it attends the gathering. The two major factors influencing this probability are the size of the party, that is, the number of people attending the gathering; and the prevalence of infectious people in the relevant population. As we will see, the latter quantity is difficult to estimate. The probability of actually getting infected by a person who has the coronavirus depends further on a number of factors; we will discuss those in a later section.
Let’s compare the risk of partying across three wonderful European cities: Amsterdam, Barcelona, and London. From July 22nd to August 4th, a total of 563, 3301, and 1101 new infections were reported (see here, here, here, and the Post Scriptum over here). This results in a relative case count of 64.50, 203.72, and 12.54 per 100,000 inhabitants, respectively. While these are the numbers of reported new infected cases, they are not the numbers of currently infectious cases. How do we arrive at those?
Estimating the true number of infectious cases
Upon infection, it usually takes a while until one can infect others, with estimates ranging from 1 – 3 days before showing symptoms. The incubation period is the time it takes from getting infected to showing symptoms. It lasts about 5 days on average, with the vast majority of people showing symptoms within 12 days (Lauer et al., 2020). Yet about a third to a half of people can be infectious without showing any symptoms (Pollán et al. 2020; He et al. 2020). Estimates suggest that one is infectious for about 8 – 10 days, but it can be longer.
These are complications, but we need to keep it simple. Currently, visitors from outside Europe must show a negative COVID-19 test or need to self-isolate for 14 days upon arrival in most European countries (see Austria, for an example). Let’s take these 14 days for simplicity, and assume conservatively that this is the time one is infectious upon getting infected. Thus, we simply take the reported number of new infected cases in the last two weeks as the reported number of currently infectious cases.
We have dealt with the first complication, but a second one immediately follows: how do we get from the reported number of infections to the true number of infections? One can estimate the true number of infections using models, or by empirically estimating the seroprevalence in the population, that is, the proportion of people who have developed antibodies.
Using the first approach, Flaxman et al. (2020) estimate the total percentage of the population that has been infected — the attack rate — across 11 European countries as of May 4th. The Netherlands was, unfortunately, not included in these estimates, and so we focus on Spain and the UK. For these countries the estimated true attack rates were 5.50% and 5.10%, respectively. Given the population of these countries and the cumulative number of reported infections, we can compute the reported attack rate. Relating this to the estimate of the true attack rate gives us an indication of the extent that the report undercounts the actual infections.
We find that cases were undercounted by a factor of about 12 in Spain and 18 in the UK (see here for code). The Netherlands undercounted cases by a factor of about 10 in April (Luc Coffeng, personal communication). The attack rate estimate for Spain is confirmed by a recent seroprevalence study, which finds a similarly low overall proportion of people who have developed antibodies (around 5%, with substantial geographical variability) in the period between April 27th and May 11th (Pollán et al. 2020). In another seroprevalence study, Havers et al. 2020 find that between March 23rd and May 12nd, reported cases from several areas in the United States undercounted true infections by a factor between 6 and 24.
Currently, the pandemic is not as severe in Europe as it was back when the above studies were conducted. Most importantly, the testing capacity has been ramped up in most countries. For example, while the proportion of positive tests in the Netherlands and the UK were 9.40% and 6.60% on the 4th of May (the end date used in the Flaxman et al. 2020 study), they currently are 1.70% and 0.60%, using most recent data from here at the time of writing. Spain’s coronavirus cases peaked roughly two weeks earlier than those of the Netherlands and the UK, and so by May 4th they had a positivity rate of 2.60%. By July 30th — the date the most recent data is available at the time of writing — their positivity rate has nearly doubled, to 5%.
Thus, while the Netherlands and the UK seem to be tracking the epidemic much more closely, which in turn implies that the factor by which they undercount the true cases is likely lower than it was previously, Spain seems to be actually doing worse.
Cases are rising again. Let’s assume therefore that the true number of infectious cases is 5 times higher then the number of reported infected cases. For simplicity, we assume the same factor for all countries, although Spain is likely undercounting the number of true cases by a larger factor than both the Netherlands and the UK. We assume the estimated relative true number of currently infectious cases to therefore be 5×64.50 = 322.50, 5×203.72 = 1018.60, and 5×12.54 = 62.70 per 100,000 residents in Amsterdam, Barcelona, and London, respectively. This includes asymptomatic carriers or those that are pre-symptomatic but still can spread the virus. We will assess how robust our results are against this particular correction factor later; in the next section, we estimate the risk of a party.
Estimating the risk of a party
What are the chances that a person who attends your party has the coronavirus and is infectious? To calculate this, we assume that party guests form an independent random sample from the population. We will discuss the implications of this crude assumption later; but for now, it allows us to estimate the desired probability in a straightforward manner.
Take Amsterdam as an example. There were 64.50 reported new cases per 100,000 inhabitants between July 22nd and August 4th. As discussed above, we take 5×64.50 = 322.50 to be the number of true infectious cases per 100,000 inhabitants. Assuming that the probability of infection is the same for all citizens (more on this later), this results in 322.50/100,000 = 0.003225, which gives a 0.3225% or 1 in 310 chance that a single party guest has the virus and can spread it.
A party with just one guest would be — intimate. So let’s invite a few others. What are the chances that at least one of them can spread the virus? We compute this by first computing the complement, that is, the probability that no party guest is infectious.
The chance that any one person from Amsterdam is not infectious is 1−0.003225 = 0.996775, or 99.68%. With our assumption of guests forming an independent random sample from the population, the probability that none of the n guests can spread the virus is 0.996775n.
In our simple calculations, the chances of at least one infectious guest showing up depends only on the size of the party and the number of true infectious cases. The figure below visualizes how these two factors interact to give the risk of a party (see Lachmann & Fox, 2020, for a similar analysis regarding school reopenings).
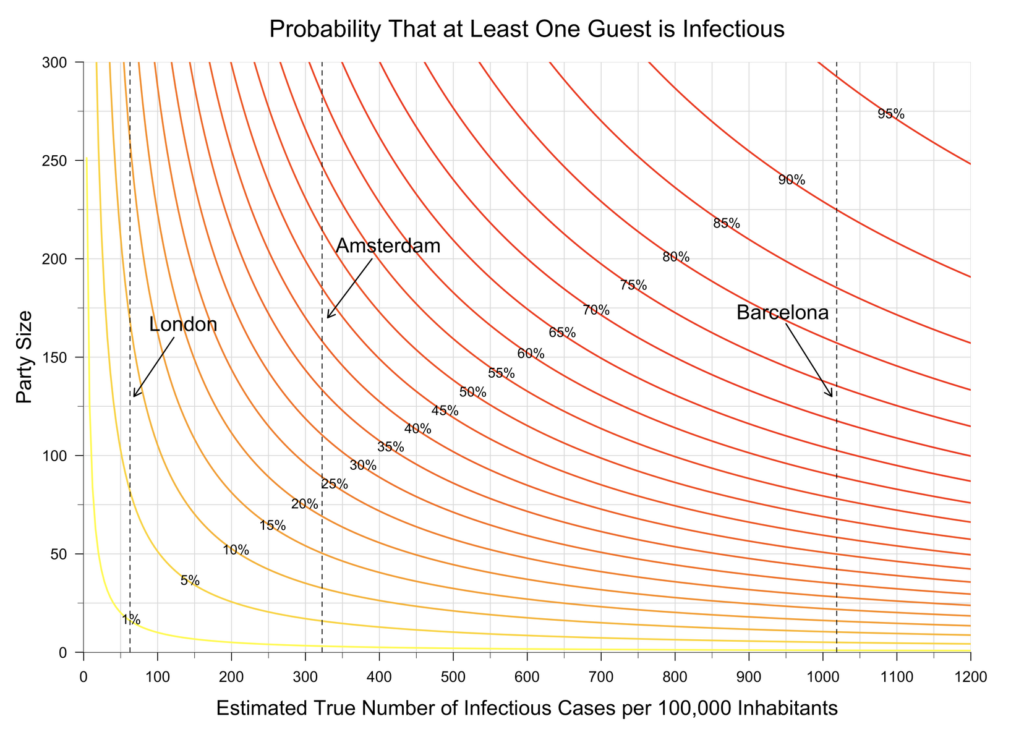
Let’s take a moment to unpack this figure. Each coloured line represents a combination of estimated true number of infectious cases and party size that yields the same party risk. For example, attending a party of size 20 when the true number of infectious cases per 100,000 inhabitants is 50 yields a party risk of about 1%, but so would, roughly, attending a party of size 10 when the true relative number of infectious cases is 100. Thus, there is a trade-off between the size of the party and the true number of infectious cases.
You can get a quick overview of the risks of parties of different sizes for a fixed number of true infectious cases by checking when the gray solid lines verticallly cross the coloured lines. Similarly, you can get a rough understanding for the risks of a party of fixed size for different numbers of true infectious cases by checking when the gray and coloured lines cross horizontally. The dotted vertical lines in the figure gives our previous estimate of the true number of infectious cases for London, Barcelona, and Amsterdam.
What’s the risk of partying in those three cities? For gatherings of size 10, 25, and 50, the probability that at least one guest arrives infectious is 0.63%, 1.56%, and 3.09% for London. For Amsterdam, the risks are substantially higher, with 3.18%, 7.76%, and 14.91%. Barcelona performs worst, with staggering risks of 9.73%, 22.58%, and 40.07%. These numbers are sobering, and I want you to take a moment to let them sink in. We will discuss the assumptions we had to make in order to arrive at them in the next section.
Do you happen to live neither in London, Amsterdam, nor Barcelona? Regardless of your area of residence, the figure allows you to estimate the party risk; just look up the local number of new cases in the last two weeks, multiply with a correction factor (we used 5), and — making the assumptions we have made so far — the plot above gives you the probability that at least one party guest will turn up infectious with the coronavirus. The assumptions we have made are very simplistic, and indeed, if you have a more elaborate way of estimating the number of currently infectious cases, then you can use that number combined with the figure to estimate the party risk.
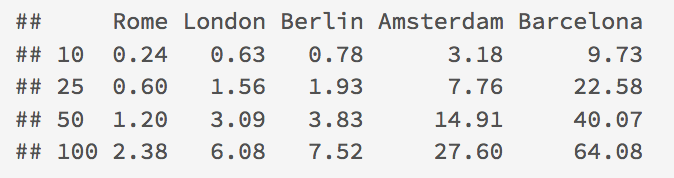
Take Rome and Berlin, for example. From July 22nd to August 4th, they had 4.82 and 15.63 cases per 100,000 inhabitants, respectively (see the Post Scriptum over here). Making the same assumptions as with the other cities, and using a correction factor of 5, the probability of having at least one infectious guest attending a party of size 25 are 0.60% for Rome and 1.93% for Berlin, respectively. The table below gives the risk for parties of size 10, 25, 50, and 100 in the five European cities.
While we have computed the party risk for a single party, this risk naturally increases when you attend multiple ones. Suppose you have been invited to parties of size 20, 35, and 50 which will take place in the next month. Let’s for simplicity assume that all guests are different each time. Let’s further assume that the number of infectious cases stays constant over the next month. Together, these assumptions allow us to calculate the total party risk as the party risk of attending a single party of size 20+35+50 = 105, which gives a considerable risk of 6.37% for London, a whopping 28.76% for Amsterdam, and a crippling 65.87% for Barcelona. It seems that, in this case, fortune does not favour the bold.
Assumptions
The analysis above is a very rough back-of-the-envelope calculation. We have made a number of crucial assumptions to arrive at some numbers. That’s useful as a first approximation; now we have at least some intuition for the problem, and we can critically discuss the assumptions we made. Most importantly, do these assumptions lead to overestimates or underestimates of the party risk?
Independence
First, and most critically, we have assumed that party guests are randomly and independently drawn from the population. It is this assumption that allowed us to compute the joint probability that none of the party guests have the virus by multiplying the probabilities of any individual being virus-free. If you have ever been to a party, you know that this is not true: instead, a considerable number of party guests usually know each other, and it is safe to say that they are similar on a range of socio-demographic variables such as age and occupation.
This means we are sampling not from the whole population, as our simple calculation assumes, but from some particular subpopulation that is well connected. Since the party guests likely share social circles or even households, the effective party size — in terms of being relevant for virus transmission — is smaller than the actual party size; this is because these individuals share the same risks. A party with 20 married couples seems safer than a party with 40 singles. This would suggest that we overestimate the risk of a party.
Uniform infection probability
At the same time, however, our calculations assume that the risk of getting the coronavirus is evenly spread across the population. We used this fact when estimating the probability that any one person has the coronavirus as the total number of cases divided by the population size.
The probability of infection is not, howevever, evenly distributed. For example, Pollán et al. (2020) report a seroprevalence of people aged 65 or more of about 6%, while people aged between 20 and 34 showed a seroprevalence of 4.4% between April 27th to May 11th. These days, however, there is a substantial rise in young people who become infected, in the United States and likely also in Europe. Because young people are less likely to develop symptoms, the virus can spread largely undetected.
Moreover, it seems to me that people who would join a party are in general more adventurous. This would increase the chances of an infectious person attending a party; thus, our calculation above may in fact underestimate the party risk.
At the same time, one would hope that people who show symptoms avoid parties. If all guests do so, then only pre-symptomatic or asymptomatic spread can occur, which would reduce the party risk by a half up to two thirds. On the flip side, people who show symptoms might get tested for COVID-19 and, upon receiving a negative test, consider it safe to attend a party. This might be foolish, however; recent estimates suggest that tests miss about 20% infections for people who show symptoms (Kucirka et al, 2020; see also here). For people without symptoms, the test performs even worse.
For parties taking place in summer, it is not unlikely that many guests engaged in holiday travel in the days or weeks before the date of the party. Since travel increases the chances of infection, this would further increase the chances that at least one party guest has contracted the coronavirus.
Estimating true infections
We have assumed that the reported number of new infected cases in the last two weeks equals the number of currently infectious cases. This is certainly an approximation. Ideally, we would have a geographically explicit model which, at any point in time and space, provides an estimate of the number of infectious cases. To my knowledge, we are currently lacking such a model.
Note that, if the people who tested positive all self-isolate or, worse, end up in hospital, this clearly curbs virus spread compared to when they would continue to roam around. The former seems more likely. Moreover, these reported cases are likely not independent either, with outbreaks usually being localized. Similar to the fact that party guests know each other, the fact that reported cases cluster would lead us to overestimate the extent of virus spread at a party.
At the same time, in the Netherlands, for example, only those that show symptoms can get tested. Since about a third to a half are asymptomatic or pre-symptomatic in the sense that they spread the virus considerably before symptom onset, the reported number of cases likely gives an undercount of infectious people.
All these complications can be summarized, roughly, in the correction factor, which gives the extent to which we believe that the reported number of infected cases undercounts the true number of currently infectious cases. We have focused on a factor of 5, but the figure above allows you to assess the sensitivity of the results to this particular choice.
All these complications can be summarized, roughly, in the correction factor, which gives the extent to which we believe that the reported number of infected cases undercounts the true number of currently infectious cases. We have focused on a factor of 5, but the figure above allows you to assess the sensitivity of the results to this particular choice.
For a very optimistic factor of 1 — this means that we do not undercount the true cases — a party of size 30 results in a risk of 0.37% for London, 1.92% for Amsterdam, and 5.93% for Barcelona. A factor of 5 results in risks of 1.82%, 9.24%, and 26.45%, respectively. A conservative estimate, using a factor of 10, results in risks of 3.61%, 17.65%, and 46.07%. You can play around with these numbers yourself. Observe how they make you feel. Personally, given what we said above about the infection probability for young and adventurous people, I am inclined to err on the side of caution.
For a very optimistic factor of 1 — this means that we do not undercount the true cases — a party of size 30 results in a risk of 0.37% for London, 1.92% for Amsterdam, and 5.93% for Barcelona. A factor of 5 results in risks of 1.82%, 9.24%, and 26.45%, respectively. A conservative estimate, using a factor of 10, results in risks of 3.61%, 17.65%, and 46.07%. You can play around with these numbers yourself. Observe how they make you feel. Personally, given what we said above about the infection probability for young and adventurous people, I am inclined to err on the side of caution.
Estimating the probability of infection
We have the defined the party risk as the probability that at least one party guest has the coronavirus and is infectious. If this person does not spread the virus to other guests, no harm is done.
This is exceedingly unlikely, however. The probability of getting infected is a function of the time one is exposed to the virus, and the amount of virus one is exposed to. Estimates suggest that about 1,000 SARS-CoV-2 infectious virus particles suffice for an infection. With breathing, about 20 viral particles diffuse into the environment per minute; this increases to 200 for speaking; coughing or sneezing can release 200,000,000 (!) virus particles. These do not all fall to the ground, but instead can remain suspended in the air and fill the whole room; thus, physical distancing alone might not be enough indoors (the extent of airborne transmission remains debated, however; see for example Klompas, Baker, & Rhee, 2020). It seems reasonable to assume that, when party guests are crowded in a room for a number of hours, many of them stand a good chance of getting infected if at least one guest is infectious. Masks would help, of course; but how would I sip my Negroni, wearing one?
It is different outdoors. A Japanese study found that virus transmission inside was about 19 times more likely than outside (Nishiura et al. 2020). Analyzing 318 outbreaks in China between January 4th and February 11th, Quian et al. (2020) found that only a single one occurred outdoors. This suggests that parties outdoors should be much safer than parties indoors. Yet outdoor parties feature elements unlike other outdoor events; for example, there are areas — such as bars or public toilets — which could become spots for virus transmission. They usually attract more people, too. Our simple calculations suggest, with a correction factor of 5, that the probability that at least one person out of 150 has the coronavirus is a staggering 38.40% in Amsterdam. While, in contrast to an indoor setting, the infected person is unlikely to infect the majority of the other guests, it seems likely that at least some guests will get the virus.
To party or not to party?
If I do not care whether I get wet or not, I will never carry an umbrella, regardless of the chances of rain. Similarly, my decision to throw (or attend) a party requires not only an estimate of how likely it is that the virus spreads at the gathering; it also requires an assessment of how much I actually care.
As argued above, it is almost certain that the virus spreads to other guests if one guest arrives infectious. Noting that all guests are young, one might be tempted to argue that the cost of virus spread is low. In fact, people who party might even be helping — heroically — to build herd immunity!
This reasoning is foolish on two grounds. First, while the proportion of infected people who die is very small for young people — Salje et al. (2020) estimate it to be 0.0045% for people in their twenties and 0.015% for people in their thirties — the picture about the non-lethal, long-term effects of the novel coronavirus is only slowly becoming clear. For some people, recovery can be lengthy — much longer than the two weeks we previously believed it would take. Known as “mild” cases, they might not be so mild after all. Moreover, the potential strange neurological effects of a coronavirus infection are becoming increasingly apparent. All told, party animals, even those guarded by their youth, might not shake it off so easily.
Suppose that, even after carefully considering the potential health dangers, one is still willing to take the chances. After all, it would be a really good party, and we young people usually eat our veggies — especially in Amsterdam. The trouble with infectious diseases, though, is that they travel: while you might be happy to take a chance, you and the majority of party guests will probably not self-isolate after the event, right? If infections occur at the party, the virus is thus likely to subsequently spread to other, more vulnerable parts of the population.
So while you might remain unharmed after attending a party, others might not. Take the story of Bob from Chicago, summarizing an actual infection chain reported by Ghinai et al. (2020):
“Bob was infected but didn’t know. Bob shared a takeout meal, served from common serving dishes, with 2 family members. The dinner lasted 3 hours. The next day, Bob attended a funeral, hugging family members and others in attendance to express condolences. Within 4 days, both family members who shared the meal are sick. A third family member, who hugged Bob at the funeral became sick. But Bob wasn’t done. Bob attended a birthday party with 9 other people. They hugged and shared food at the 3 hour party. Seven of those people became ill.
But Bob’s transmission chain wasn’t done. Three of the people Bob infected at the birthday went to church, where they sang, passed the tithing dish etc. Members of that church became sick. In all, Bob was directly responsible for infecting 16 people between the ages of 5 and 86. Three of those 16 died.”
These events took place before much of the current corona measures were put in place, but the punchline remains: parties are a matter of public, not only individual health. Don’t be like Bob.